All Data Points Explained
- The
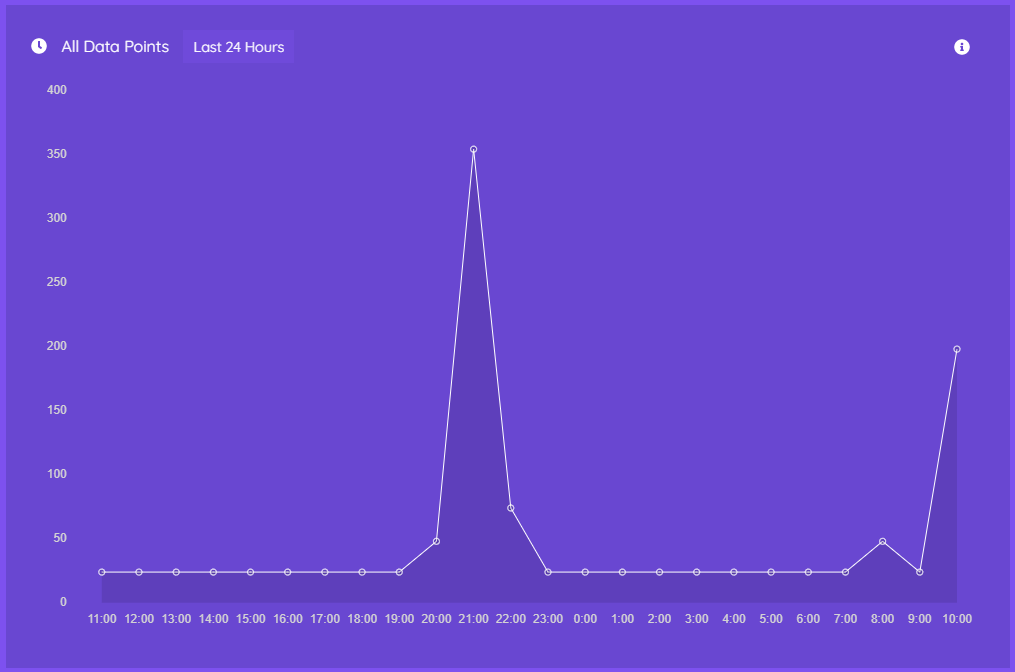
All Data Points chart is displayed in the Dashboard on micro stat
- The purpose of the chart is to show you when Data Points have been recorded over the past 24 hours
How to use it
- Take a look at the chart and see if it can help you see busy periods for your app.
- When the chart shows that your app is busy, there should be lots of data in your active metrics which you can review.
- If there is not much going on, then your app is quiet and you can check back at another time
- If the chart is bustling with lots of Data Points it may be a good idea to check on your key metrics.
Submit a Ticket