Busy Metrics Explained
- The
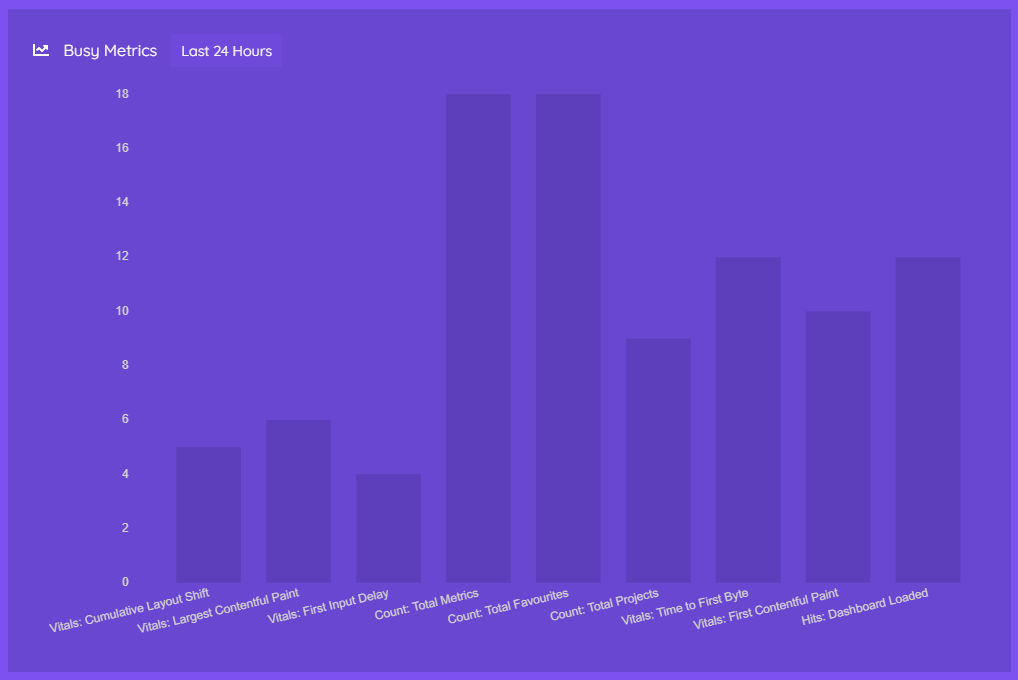
Busy Metrics chart is displayed in the Dashboard within micro stat.
- The purpose of the chart is to show you which metrics might be worth looking at, based on their activity in the last 24 hours.
How to use it
- Each Metric which has a Data Point recorded in the last 24 hours is represented in the chart
- Take a look at a Metric which shows a lot of activity in the past day, it may have insights for you to find.
- Click or tap on a Metric in the chart to drill down and see what has changed.
Submit a Ticket